Fig. 3
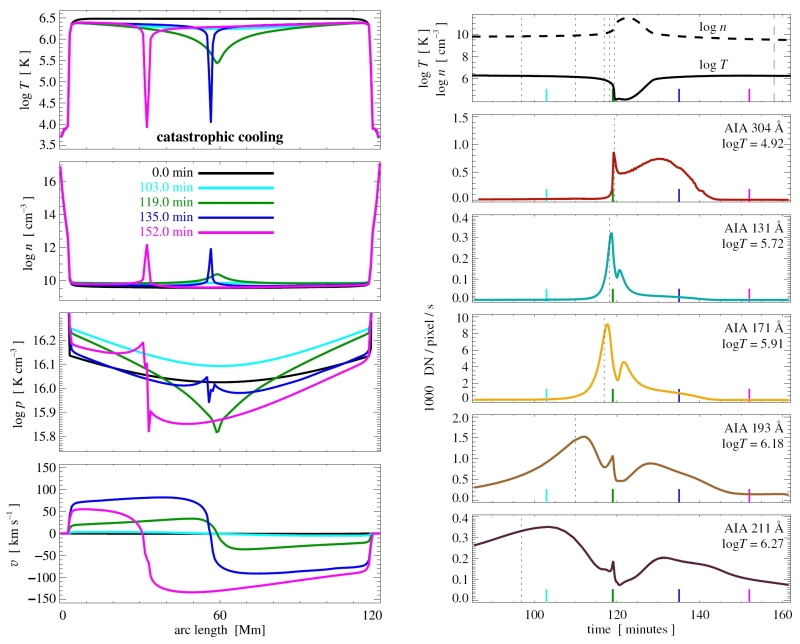
Plasma properties and synthesized emission of AIA channels for 1D loop model undergoing catastrophic cooling. The left column shows snapshots of the profiles of temperature, log T, density, log n, pressure log p, and velocity, v along the loop (v > 0 in direction of positive arc length). The right column shows the temporal evolution of the temperature and density at the loop apex (top right). The other panels in the right column show the expected count rates for several AIA/SDO channels if the loop top is observed edge-on (one AIA pixel covering apex at 38 Mm height). The short vertical markers indicate the time for which the snapshots are shown in the left column. The vertical dotted lines indicate the times when the temperature at the loop top (top panel) reaches the temperature of maximum response for the AIA channels. These temperatures are given (in log T [K]) with each panel. See Sects. 3.1 and 4.1. A movie of the temporal evolution shown in the left panels is available in the on-line edition.
Current usage metrics show cumulative count of Article Views (full-text article views including HTML views, PDF and ePub downloads, according to the available data) and Abstracts Views on Vision4Press platform.
Data correspond to usage on the plateform after 2015. The current usage metrics is available 48-96 hours after online publication and is updated daily on week days.
Initial download of the metrics may take a while.