Fig. 2
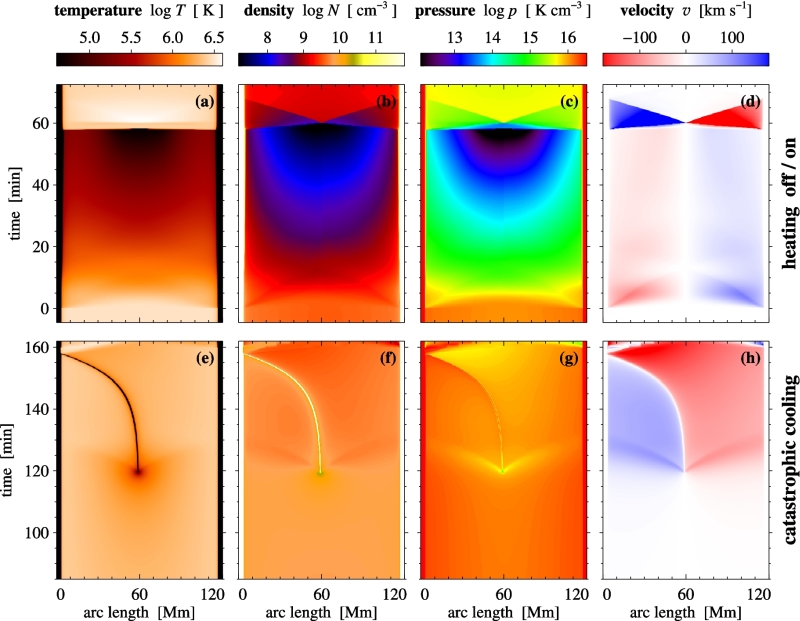
Plasma parameters in numerical loop models as a function of arc length along loop and time. The loop is semi-circular with the apex at 60 Mm and the footpoints at 0 and 120 Mm. Shown are temperature, density, pressure, and velocity (from left to right) for the two numerical experiments. The top row displays the results where the heating was shut off (at t = 0) and then turned on again at t ≈ 57 min (see Sect. 3.2). In the bottom row, the results for the case of catastrophic cooling are shown (see Sect. 3.1), where t = 0 refers to the time when the heating scale length was reduced. The condensation sets in at around t ≈ 120 min. In both cases the time axis spans about 70 min. Positive velocities (shown in blue) are in the direction of increasing arc length.
Current usage metrics show cumulative count of Article Views (full-text article views including HTML views, PDF and ePub downloads, according to the available data) and Abstracts Views on Vision4Press platform.
Data correspond to usage on the plateform after 2015. The current usage metrics is available 48-96 hours after online publication and is updated daily on week days.
Initial download of the metrics may take a while.