Fig. 1
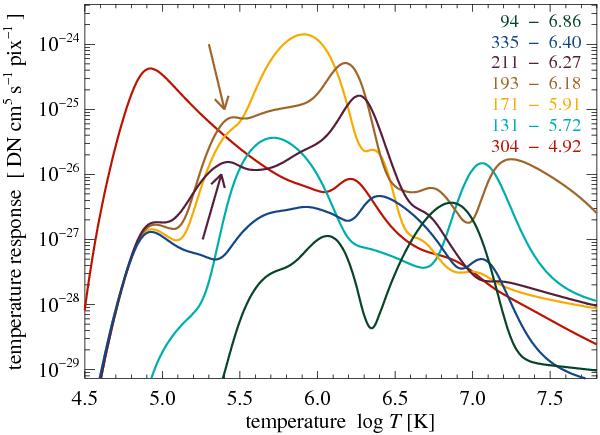
Temperature response functions of the AIA channels as stored in SolarSoft at the time of publication of this study; following Boerner et al. (2011). Noted are the centre wavelengths in Å and the peak of the temperature response in log T [K ] . The secondary peaks at low temperatures in the 193 Å and 211 Å channels are indicated by arrows. See Sect. 2.3.
Current usage metrics show cumulative count of Article Views (full-text article views including HTML views, PDF and ePub downloads, according to the available data) and Abstracts Views on Vision4Press platform.
Data correspond to usage on the plateform after 2015. The current usage metrics is available 48-96 hours after online publication and is updated daily on week days.
Initial download of the metrics may take a while.