Free Access
Fig. 9
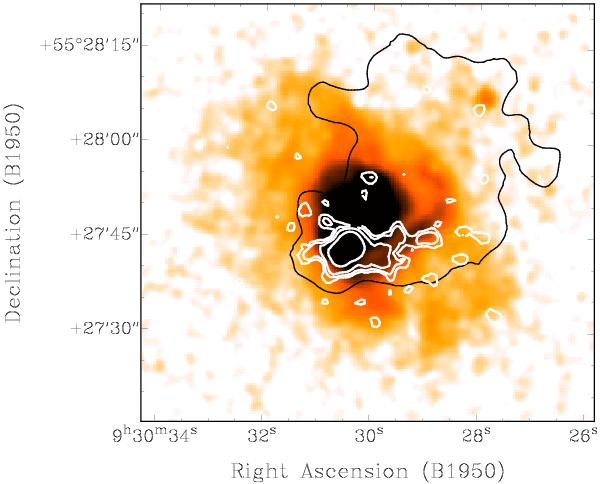
Hα image (Gil de Paz et al. 2003) superimposed with the H i emission. White contours show the H i emission at  resolution, integrated across the velocity range 800–770 km s-1, and correspond to 5, 10, 20, 40 × 1020 atoms cm-2. The black line shows the pseudo-3σ contour of the total H i map at 5′′ resolution.
Current usage metrics show cumulative count of Article Views (full-text article views including HTML views, PDF and ePub downloads, according to the available data) and Abstracts Views on Vision4Press platform.
Data correspond to usage on the plateform after 2015. The current usage metrics is available 48-96 hours after online publication and is updated daily on week days.
Initial download of the metrics may take a while.