Fig. 8
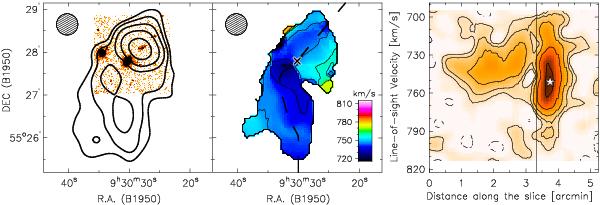
The H i emission at 30′′ resolution, after the subtraction of the main body. Left: B-band image overlaid with the total H i map. Contours are at 2.4, 4.8, 9.6, 19.2 × 10¹⁹ atoms cm-2. Middle: velocity field. Contours range from 735.8 to 767 km s-1 with steps of 10.4 km s-1. The cross shows the position of I Zw 18 A. The dashed line shows the path followed to obtain the position–velocity diagram. Right: position–velocity diagram. Contours are at − 1.5 (dashed), 1.5, 3, 6, 12σ, where σ = 0.3 mJy/beam. The vertical line corresponds to the cross in the velocity field. The star shows the Hα velocity and the spatial position of I Zw 18 C.
Current usage metrics show cumulative count of Article Views (full-text article views including HTML views, PDF and ePub downloads, according to the available data) and Abstracts Views on Vision4Press platform.
Data correspond to usage on the plateform after 2015. The current usage metrics is available 48-96 hours after online publication and is updated daily on week days.
Initial download of the metrics may take a while.