Fig. 6
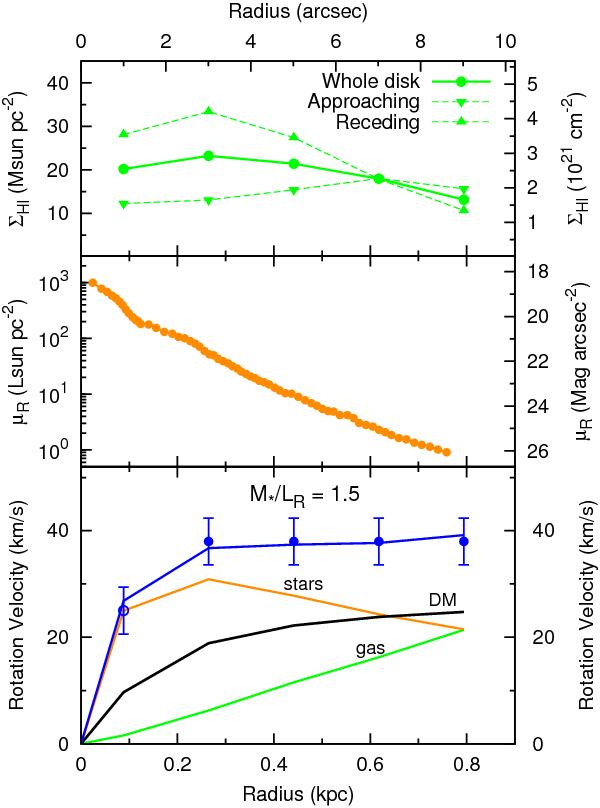
Top: H i surface density profile (inclination corrected), derived by ellipse averaging over the entire disk (dots) and over the approaching and receding sides separately (down-triangles and up-triangles, respectively). Middle: R-band surface brightness profile (from Papaderos et al. 2002). Bottom: “maximum disk” decomposition of the rotation curve. Dots and circles show the observed curve. Lines show the contributions of the gas, stars, and dark matter and the resulting rotation curve.
Current usage metrics show cumulative count of Article Views (full-text article views including HTML views, PDF and ePub downloads, according to the available data) and Abstracts Views on Vision4Press platform.
Data correspond to usage on the plateform after 2015. The current usage metrics is available 48-96 hours after online publication and is updated daily on week days.
Initial download of the metrics may take a while.