Fig. 5
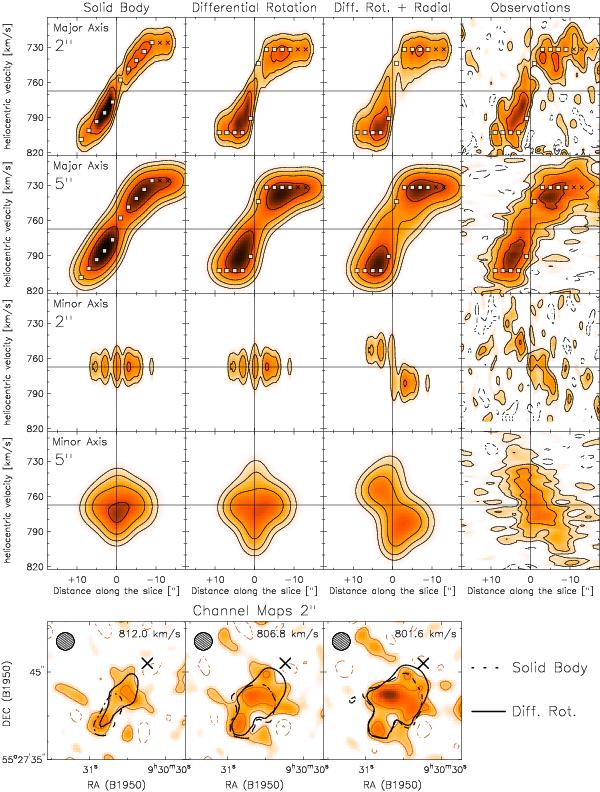
Comparison between different 3D kinematical models and the observations. Top: position–velocity diagrams at a resolution of both 2′′ and 5′′. The slices are taken along the major and minor axes, as indicated in Fig. 4 (left). Contours are at − 1.5 (dashed), 1.5, 3, 6, 12 × σ. Bottom: channel maps at 2′′ resolution (red contours) superimposed with two models: differential rotation (black-solid contours) and solid body rotation (black-dashed contours). Contours are at 2σ. The cross marks the galaxy centre. The circle shows the beam size. See text for details.
Current usage metrics show cumulative count of Article Views (full-text article views including HTML views, PDF and ePub downloads, according to the available data) and Abstracts Views on Vision4Press platform.
Data correspond to usage on the plateform after 2015. The current usage metrics is available 48-96 hours after online publication and is updated daily on week days.
Initial download of the metrics may take a while.