Fig. 4
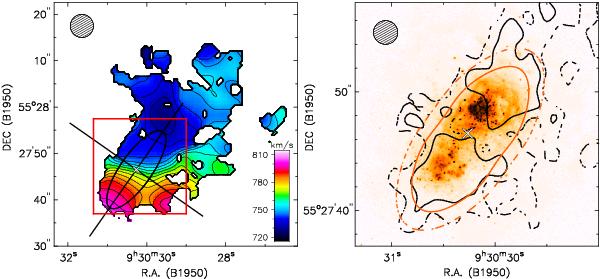
Left: velocity field at 5′′ resolution. The ellipse shows the modelled disk. The centre, and both the major and the minor axes are shown. The box shows the area covered by the right panel. The circle shows the beam. Contours are the same as in Fig. 2. Right: HST image superimposed with the observed H i map at 2′′ (black) and the H i map obtained from a 3D model with i = 70° and z0 = 100 pc (red). Contours are at 3 (dashed) and 6 (solid) × 1021 atoms cm-2. The cross marks the centre and the circle shows the beam.
Current usage metrics show cumulative count of Article Views (full-text article views including HTML views, PDF and ePub downloads, according to the available data) and Abstracts Views on Vision4Press platform.
Data correspond to usage on the plateform after 2015. The current usage metrics is available 48-96 hours after online publication and is updated daily on week days.
Initial download of the metrics may take a while.