Fig. 2
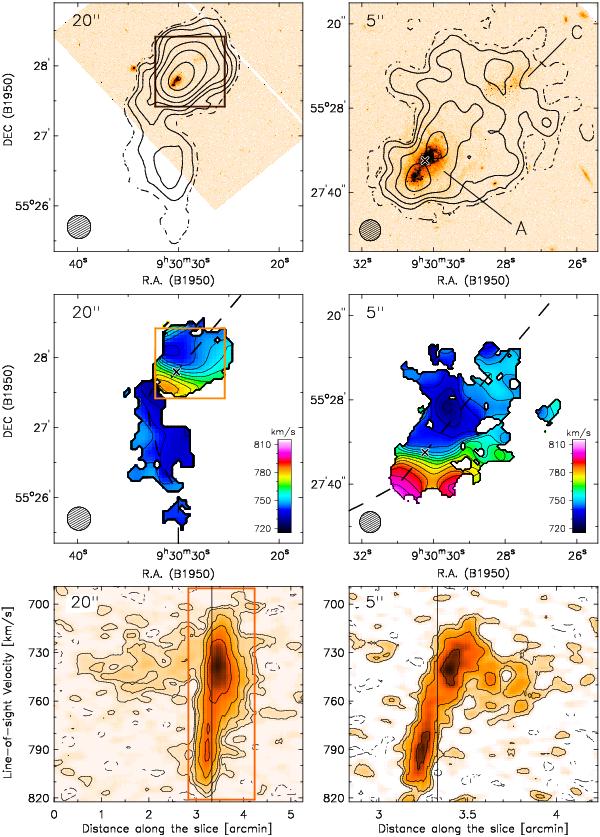
Top: integrated H i maps at a resolution of 20′′ (left) and 5′′ (right), superimposed on a HST image (from Aloisi et al. 2007). The box in the left panel shows the area covered by the right panel. The dashed line corresponds to the pseudo –1.5σ density contour. In the map at 20′′, contours are at 0.25 (dashed), 0.5, 1, 2, 4, 8, 16 × 1020 atoms cm-2. In the map at 5′′, contours are at 3 (dashed), 6, 12, 24, 48 × 1020 atoms cm-2. The circle shows the beam size. Middle: velocity fields at a resolution of 20′′ (left) and 5′′ (right). The box in the left panel shows the area covered by the right panel. Contours range from 722.4 to 805.6 km s-1, with steps of 5.2 km s-1. The circle shows the beam size. The dashed line shows the path followed to obtain the position–velocity diagram. Bottom: position–velocity diagrams at a resolution of 20′′ (left) and 5′′ (right). Contours are at − 1.5 (dashed), 1.5, 3, 6, 12, 24 × σ. The box in the left panel shows the region covered by the right panel. The vertical line corresponds to the cross in the velocity fields.
Current usage metrics show cumulative count of Article Views (full-text article views including HTML views, PDF and ePub downloads, according to the available data) and Abstracts Views on Vision4Press platform.
Data correspond to usage on the plateform after 2015. The current usage metrics is available 48-96 hours after online publication and is updated daily on week days.
Initial download of the metrics may take a while.