Free Access
Fig. 1
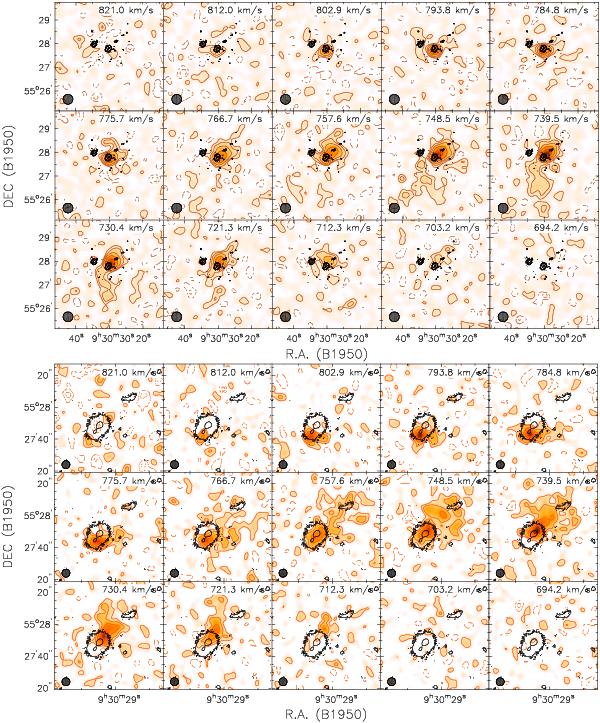
Channel maps at a resolution of 20′′ (top) and 5′′ (bottom). Red-solid contours are at 1.5, 3, 6, 12, 24 × σ. Red-dashed contours are at –3, − 1.5 × σ. Black contours show two isophotes of a B-band image (from Gil de Paz et al. 2003); the object to the north-east (RA = 9h30m34s, Dec = 55°28′′) is a foreground star.
This figure is made of several images, please see below:
Current usage metrics show cumulative count of Article Views (full-text article views including HTML views, PDF and ePub downloads, according to the available data) and Abstracts Views on Vision4Press platform.
Data correspond to usage on the plateform after 2015. The current usage metrics is available 48-96 hours after online publication and is updated daily on week days.
Initial download of the metrics may take a while.