Fig. 4
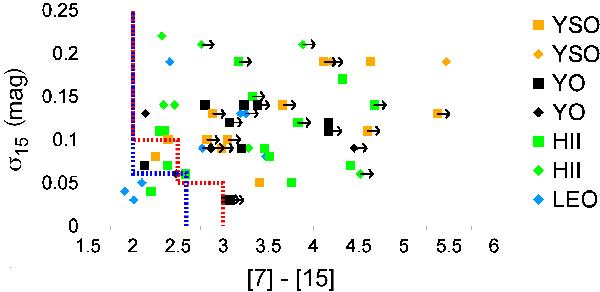
The image shows the spatial extension parameter σ15 plotted against the [7]–[15] color. The arrows indicate lower limits of the [7]–[15] colors for the sources that were only detected at 15 μm. The squares mark the sources whose [7] and [15] colors were not observed at the same time, diamonds highlight sources that were simultaneously observed at 7 and 15 μm. The red line represents the selection criteria of Paper I, the blue line the selection criteria defined in this publication. The image shows that color selection criteria that are combined with the spatial extension parameter σ15 permit the distinction between young and evolved objects with a low contamination rate of LEOs.
Current usage metrics show cumulative count of Article Views (full-text article views including HTML views, PDF and ePub downloads, according to the available data) and Abstracts Views on Vision4Press platform.
Data correspond to usage on the plateform after 2015. The current usage metrics is available 48-96 hours after online publication and is updated daily on week days.
Initial download of the metrics may take a while.