Fig. 2
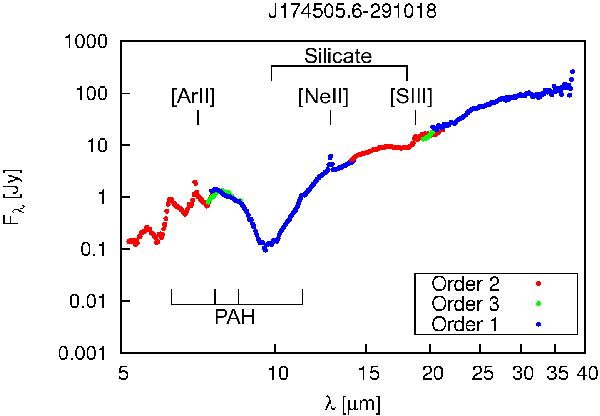
Background-subtracted spectrum of the source J174505.6–291018. The data of the different subslits are presented by the three different colors (green: SL2 or LL2; blue: SL3 or LL3; red: SL1 or LL1). Denoted are the silicate absorption features, the PAH emission bands, and the forbidden fine structure lines [Ar ii], [Ne ii], and [S iii].
Current usage metrics show cumulative count of Article Views (full-text article views including HTML views, PDF and ePub downloads, according to the available data) and Abstracts Views on Vision4Press platform.
Data correspond to usage on the plateform after 2015. The current usage metrics is available 48-96 hours after online publication and is updated daily on week days.
Initial download of the metrics may take a while.