Free Access
Fig. 1
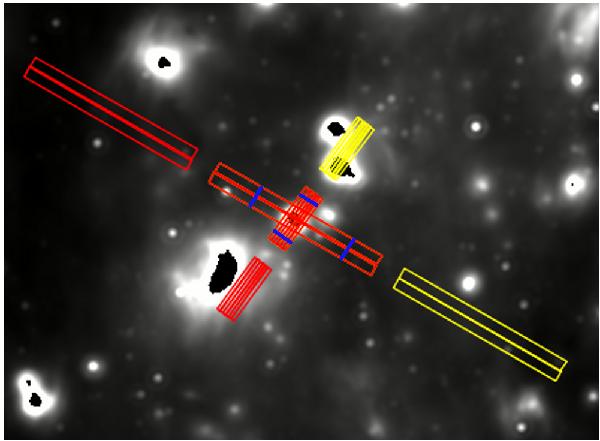
Footprint of the IRS slits shown on a 24 μm image around J174505.6–291018. In that case, the map consists of 6 pointings with the SL module, and 2 pointings with the LL module. Positions in the slits where background spectra were obtained are shown in blue.
Current usage metrics show cumulative count of Article Views (full-text article views including HTML views, PDF and ePub downloads, according to the available data) and Abstracts Views on Vision4Press platform.
Data correspond to usage on the plateform after 2015. The current usage metrics is available 48-96 hours after online publication and is updated daily on week days.
Initial download of the metrics may take a while.