Fig. 4
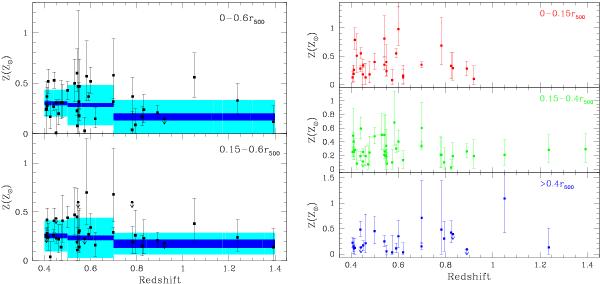
Left: abundance measured by EPIC XMM-Newton as a function of the redshift for the clusters in our sample including the emission from the whole cluster at r < 0.6r500 (top) and excising the core (bottom). The error bars in Z are at 1σ, while shaded areas show the weighted mean of the abundance with its error (blue) and rms dispersion (cyan) in three redshift bins. Right: abundance measured by EPIC XMM-Newton as a function of the redshift for the clusters in our sample in different spatial bins (from top to bottom: 0–0.15 r500, 0.15–0.4 r500, and > 0.4r500), with 1σ error bars indicated.
Current usage metrics show cumulative count of Article Views (full-text article views including HTML views, PDF and ePub downloads, according to the available data) and Abstracts Views on Vision4Press platform.
Data correspond to usage on the plateform after 2015. The current usage metrics is available 48-96 hours after online publication and is updated daily on week days.
Initial download of the metrics may take a while.