Fig. 2
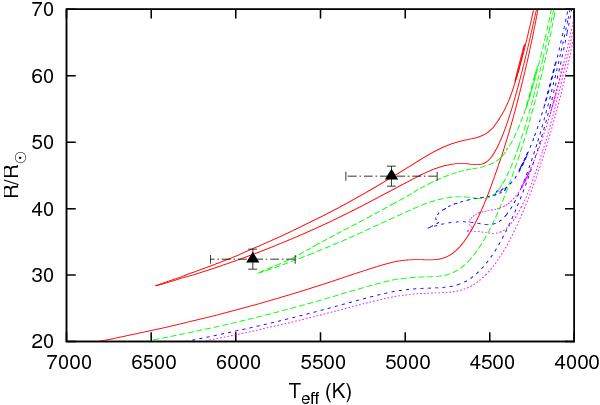
Stellar evolution tracks computed using the Heger et al. (2000) stellar evolution program with mass M = 4.21 M⊙, convective core overshooting with αc = 0.2 and varying values of the helium abundance, Y, and metallicity, Z. The Heger et al. (2000) code assumes the values of Y and Z to be correlated, such that dY/dZ = 2. The red solid line represents Y,Z = 0.250,0.005, green dashed line 0.256,0.008, blue small-dashed line 0.264,0.012 and the magenta dotted line is 0.270,0.015. The black triangles with error bars represent the observed radius and effective temperature of the binary components.
Current usage metrics show cumulative count of Article Views (full-text article views including HTML views, PDF and ePub downloads, according to the available data) and Abstracts Views on Vision4Press platform.
Data correspond to usage on the plateform after 2015. The current usage metrics is available 48-96 hours after online publication and is updated daily on week days.
Initial download of the metrics may take a while.