Fig. 2
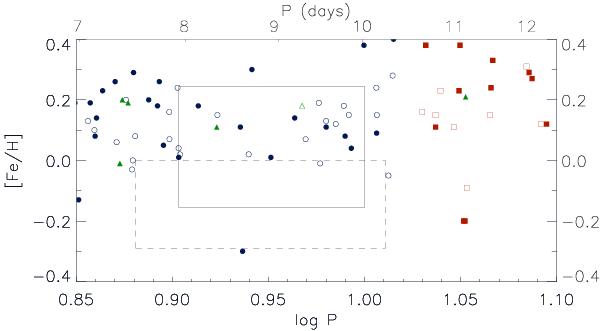
Distribution of [Fe/H] values near the “zone of avoidance”. Cepheids with known companions are also plotted. The meaning of the symbols is the same as in Fig. 1. The theoretically predicted region of the Galactic Cepheid desert is represented by the solid line box, while the observed desert region is marked as the dashed line box.
Current usage metrics show cumulative count of Article Views (full-text article views including HTML views, PDF and ePub downloads, according to the available data) and Abstracts Views on Vision4Press platform.
Data correspond to usage on the plateform after 2015. The current usage metrics is available 48-96 hours after online publication and is updated daily on week days.
Initial download of the metrics may take a while.