Fig. 5
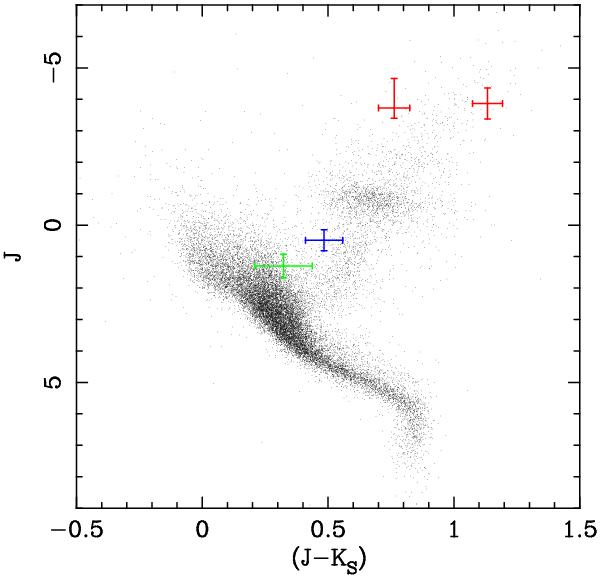
Colour–magnitude diagram using Hipparcos data (Perryman & ESA 1997). The green point indicates the position of a quiescent U Sco, and the red point the location of a quiescent RS Oph (left) and T CrB (right). The blue point shows the position of a quiescent KT Eri. Although the position of U Sco appears coincident with the upper main sequence, the system contains a sub-giant secondary.
Current usage metrics show cumulative count of Article Views (full-text article views including HTML views, PDF and ePub downloads, according to the available data) and Abstracts Views on Vision4Press platform.
Data correspond to usage on the plateform after 2015. The current usage metrics is available 48-96 hours after online publication and is updated daily on week days.
Initial download of the metrics may take a while.