Fig. 1
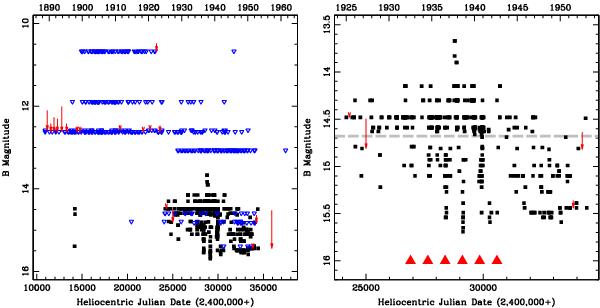
Harvard College Observatory archival light curve of KT Eri. The black squares indicate B-band magnitudes, the blue triangles upper limits. The red arrows indicate gaps in the coverage that could accommodate an un-detected outburst similar to that in 2009. The length of the arrow tails are proportional to the probability of “missing” an outburst that occurred between two consecutive Harvard plates (length of one magnitude indicates a 100% probability). Left: entire light curve between 1885 and 1965. Right: light curve between 1923.5 and 1954.5. These data show a highly variable progenitor with ⟨ B ⟩ = 14.7 ± 0.4 (grey dashed line) and a full amplitude variability of around one magnitude. The red triangles show the derived period of 737 days, which coincides with the dips in the light curve.
Current usage metrics show cumulative count of Article Views (full-text article views including HTML views, PDF and ePub downloads, according to the available data) and Abstracts Views on Vision4Press platform.
Data correspond to usage on the plateform after 2015. The current usage metrics is available 48-96 hours after online publication and is updated daily on week days.
Initial download of the metrics may take a while.