Fig. 1
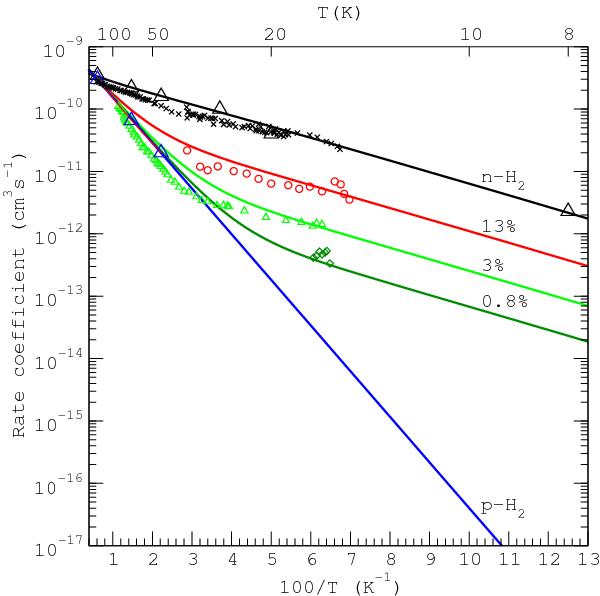
Comparison of the rate coefficient as given by Eq. (3) to experimental data for the reaction of N+ with n-H2 and p-H2 with different o-H2 admixtures: 13%, 3%, 0.8%, and 0% (blue line). The small symbols are taken from Gerlich (1993) while the large triangles are CRESU results from Marquette et al. (1988). The solid lines correspond to Eq. (3) of the present paper.
Current usage metrics show cumulative count of Article Views (full-text article views including HTML views, PDF and ePub downloads, according to the available data) and Abstracts Views on Vision4Press platform.
Data correspond to usage on the plateform after 2015. The current usage metrics is available 48-96 hours after online publication and is updated daily on week days.
Initial download of the metrics may take a while.