Fig. 6
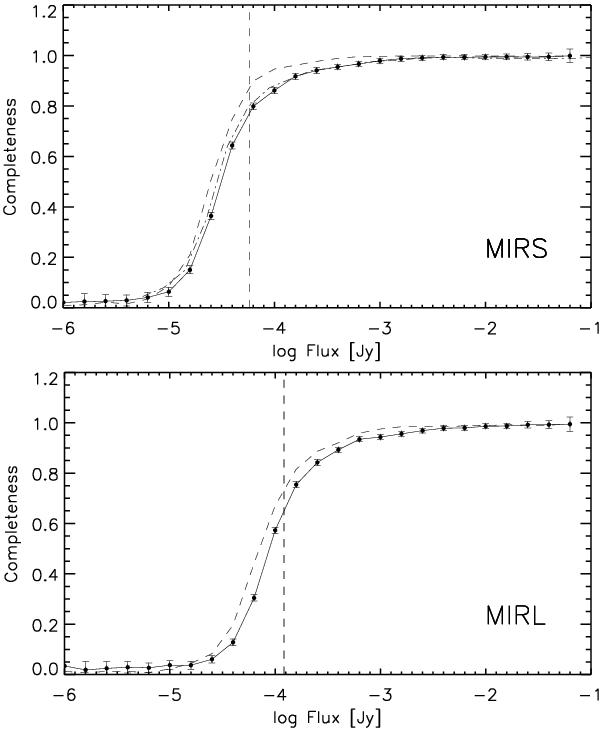
Completeness simulation for the MIR-S and MIR-L channels. Solid and dashed lines represent the completeness calculated with the positive and negative images, respectively. For these cases, we assume that artificial sources have a flat spectrum in fν. The dot-dashed line in the upper panel indicates the completeness for red sources (see text in detail), where we adopted the average of 7, 9, and 11 μm flux for red sources. The vertical dashed lines indicate 5σ sensitivity in Wada et al. (2008) at S9W and L18W bands for MIR-S and MIR-L, respectively.
Current usage metrics show cumulative count of Article Views (full-text article views including HTML views, PDF and ePub downloads, according to the available data) and Abstracts Views on Vision4Press platform.
Data correspond to usage on the plateform after 2015. The current usage metrics is available 48-96 hours after online publication and is updated daily on week days.
Initial download of the metrics may take a while.