Fig. 11
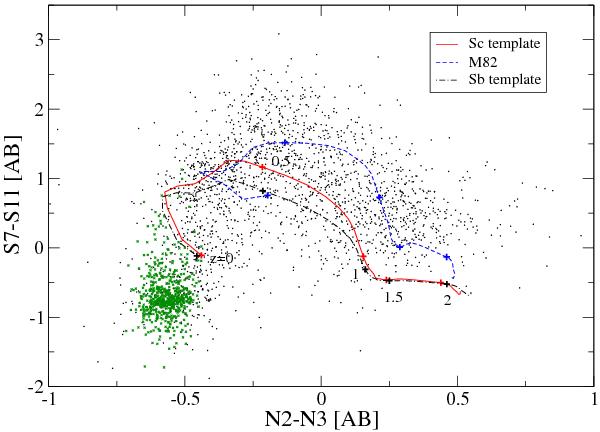
Colour–colour plot with AKARI bands, using N2,N3,S7 and S11. Dots (black) and small crosses (green) indicate galaxies and stars, respectively, detected at more than 3σ in all of 4 bands. Solid line (red) indicates the colour of Sc galaxy template as a function of redshift. Dot-dashed (black) and dashed (blue) lines are for Sb galaxy and M 82 template, respectively. The SED templates are taken from Polletta et al. (2007).
Current usage metrics show cumulative count of Article Views (full-text article views including HTML views, PDF and ePub downloads, according to the available data) and Abstracts Views on Vision4Press platform.
Data correspond to usage on the plateform after 2015. The current usage metrics is available 48-96 hours after online publication and is updated daily on week days.
Initial download of the metrics may take a while.