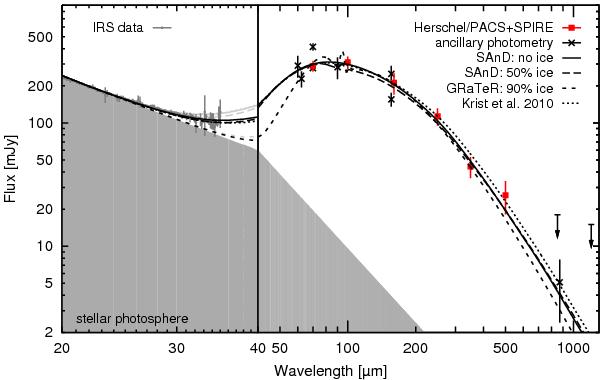
Fig. 5

Spectral energy distributions of the best-fit power law-based models. The photometry points used for the fitting are overplotted. Note that the horizontal stretch is different for wavelengths smaller than 40 μm. To compare the models to the IRS data from the standard pipeline, we corrected the model SEDs for slit loss and then applied a point-source correction. The uncorrected model SEDs are plotted with light grey lines.
Current usage metrics show cumulative count of Article Views (full-text article views including HTML views, PDF and ePub downloads, according to the available data) and Abstracts Views on Vision4Press platform.
Data correspond to usage on the plateform after 2015. The current usage metrics is available 48-96 hours after online publication and is updated daily on week days.
Initial download of the metrics may take a while.


