Fig. 2
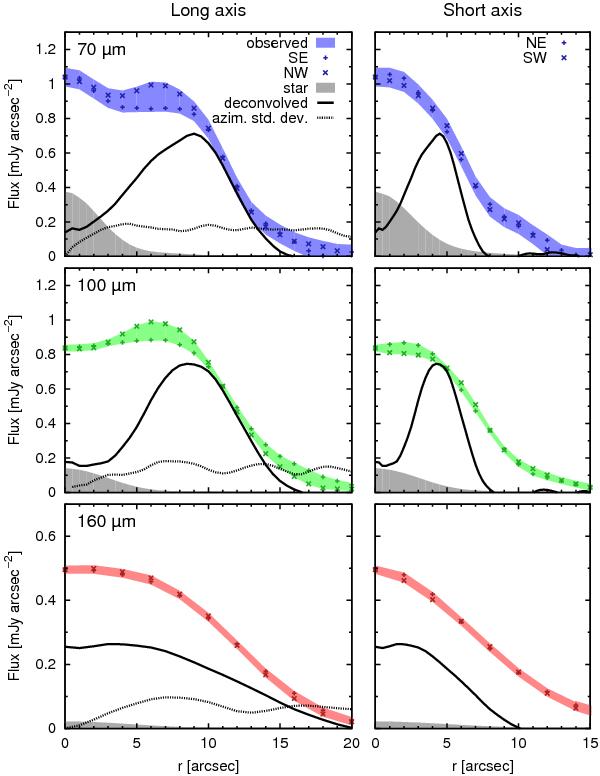
Radial profiles of surface brightness at (top to bottom) 70, 100, and 160 μm: (left) along the long axis and (right) along the short axis. The coloured shaded areas mark the uncertainty, while symbols represent the two respective directions along each axis. In the lower-left of each panel, the stellar contribution is plotted. Azimuthally averaged radial profiles of Wiener deconvolved and deprojected images are given as solid line, and their azimuthal standard deviations are represented as dotted lines, both in arbitrary units.
Current usage metrics show cumulative count of Article Views (full-text article views including HTML views, PDF and ePub downloads, according to the available data) and Abstracts Views on Vision4Press platform.
Data correspond to usage on the plateform after 2015. The current usage metrics is available 48-96 hours after online publication and is updated daily on week days.
Initial download of the metrics may take a while.