Fig. 1
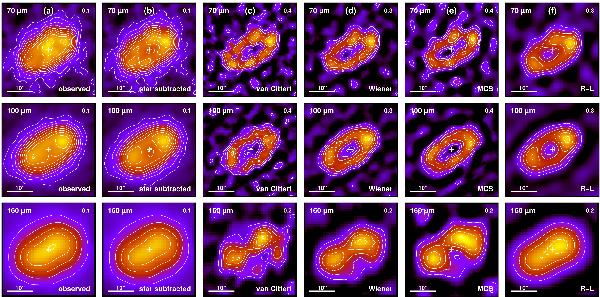
Herschel/PACS images of HD 207129 at (top to bottom) 70, 100, and 160 μm. Columns a) and b) show the observed and star-subtracted images, respectively. Columns c) to f) show deconvolved images using the following methods: c) van Cittert, d) FFT with a Wiener filter, e) MCS code, f) Richardson-Lucy. Flux steps (in mJy/arcsec2) between solid isolines are indicated in the top-right corner of each panel. The photocentre of the disk, i.e. the assumed stellar position, is indicated by a cross. In every panel, North is up and East is left.
Current usage metrics show cumulative count of Article Views (full-text article views including HTML views, PDF and ePub downloads, according to the available data) and Abstracts Views on Vision4Press platform.
Data correspond to usage on the plateform after 2015. The current usage metrics is available 48-96 hours after online publication and is updated daily on week days.
Initial download of the metrics may take a while.