Fig. 7
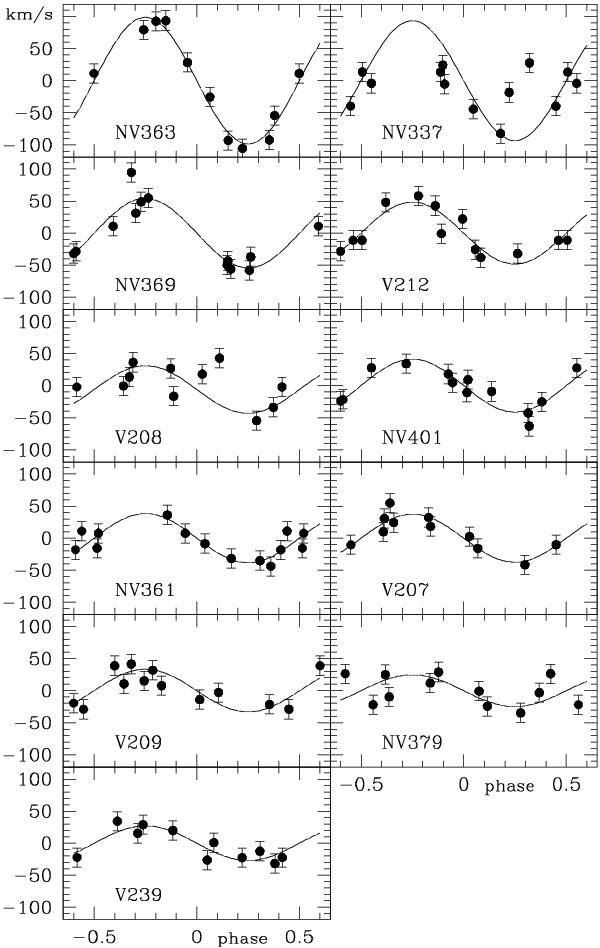
Radial velocity curves of photometric variables. For each variable, the observational data (points) are phased with the corresponding photometric period Pphot taken from Kaluzny et al. (2004). The only exception is NV379, where a period of 0.5Pphot was used for phasing. Smooth curves are sinusoidal fits. Zero points on vertical axes correspond to systemic velocities. The standard error in the velocity measurement, estimated in Sect. 3.1, is 15 km s-1.
Current usage metrics show cumulative count of Article Views (full-text article views including HTML views, PDF and ePub downloads, according to the available data) and Abstracts Views on Vision4Press platform.
Data correspond to usage on the plateform after 2015. The current usage metrics is available 48-96 hours after online publication and is updated daily on week days.
Initial download of the metrics may take a while.