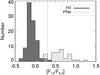
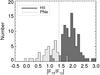
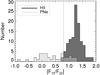
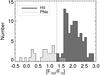
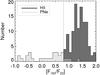
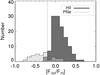
Fig. 8

IR color distributions for H II regions and PNe. Shown are the six colors (the log of the flux ratio) best able to discriminate between H II regions (dark grey) and PNe (light grey). The hatched areas contain contributions from both H II regions and PNe. The vertical dotted lines show our proposed cutoff value for separating the two populations.
Current usage metrics show cumulative count of Article Views (full-text article views including HTML views, PDF and ePub downloads, according to the available data) and Abstracts Views on Vision4Press platform.
Data correspond to usage on the plateform after 2015. The current usage metrics is available 48-96 hours after online publication and is updated daily on week days.
Initial download of the metrics may take a while.