Fig. 6
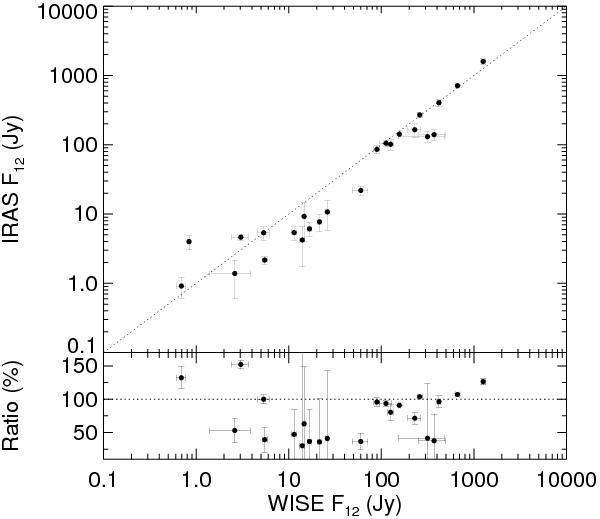
Correlation between WISE and IRAS. In the top panel we plot the WISE 12 μm flux versus the IRAS 12 μm flux; in the bottom panel we show the ratio of the IRAS 12 μm flux to the WISE 12 μm flux, as a percentage. The dotted line in both panels shows a one to one relationship. Errors are the 1σ photometric uncertainties. There is a correlation between the two fluxes over four orders of magnitude, although there is significant scatter in the relationship. This scatter is likely due in large part to the difficulty of IRAS photometric measurements. We have included only H II regions that are not saturated in the WISE 12 μm band.
Current usage metrics show cumulative count of Article Views (full-text article views including HTML views, PDF and ePub downloads, according to the available data) and Abstracts Views on Vision4Press platform.
Data correspond to usage on the plateform after 2015. The current usage metrics is available 48-96 hours after online publication and is updated daily on week days.
Initial download of the metrics may take a while.