Free Access
Fig. 4
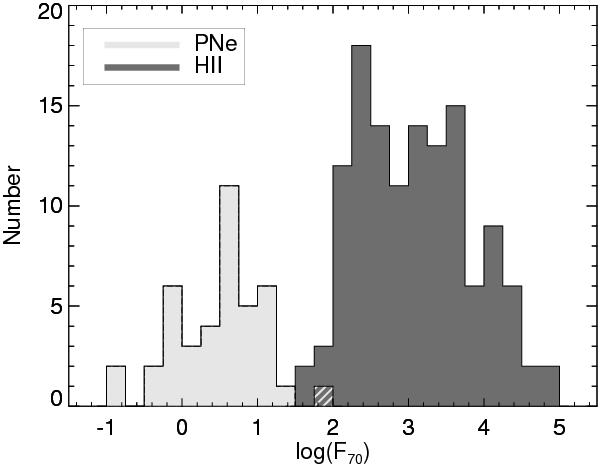
The distributions of 70 μm fluxes. The fluxes of H II regions are shown in dark grey while those of PNe are shown in light grey. The hatched box has contributions from both H II regions and PNe. Our sample of H II regions is significantly brighter than our sample of PNe.
Current usage metrics show cumulative count of Article Views (full-text article views including HTML views, PDF and ePub downloads, according to the available data) and Abstracts Views on Vision4Press platform.
Data correspond to usage on the plateform after 2015. The current usage metrics is available 48-96 hours after online publication and is updated daily on week days.
Initial download of the metrics may take a while.