Fig. 5
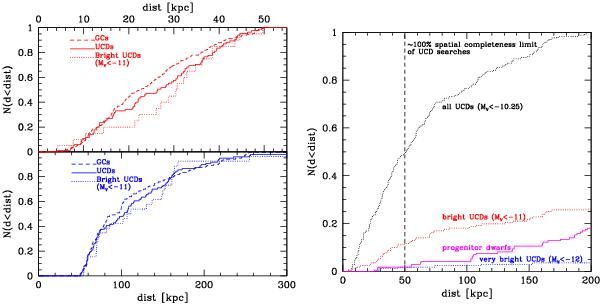
Left panel: projected radial distribution of GCs and UCDs in the Fornax cluster, see also Fig. 3. The upper plot with the red curves corresponds to the distribution within 50 kpc, with x-axis limits on the top. The lower plot with the blue curves corresponds to the distribution outside of 50 kpc, with x-axis limits on the bottom. Solid lines are UCDs (MV < −10.25 mag). Dotted lines are bright UCDs with MV < −11.0 mag. Dashed lines are GCs (MV > −10.25 mag). There is mild evidence (92% significance according to a KS test) of a more extended distribution of bright UCDs compared to GCs within the inner 50 kpc. Right panel: cumulative radial distribution of UCDs (black, red, and blue curves), compared to that of dwarf galaxies (magenta) in the postulated progenitor magnitude range of −18.5 < MV < −14 mag (Bekki et al. 2003); see also Fig. 3. The maximum of the various curves have been re-normalized to represent the respective total number of objects in each sample.
Current usage metrics show cumulative count of Article Views (full-text article views including HTML views, PDF and ePub downloads, according to the available data) and Abstracts Views on Vision4Press platform.
Data correspond to usage on the plateform after 2015. The current usage metrics is available 48-96 hours after online publication and is updated daily on week days.
Initial download of the metrics may take a while.