Fig. 4
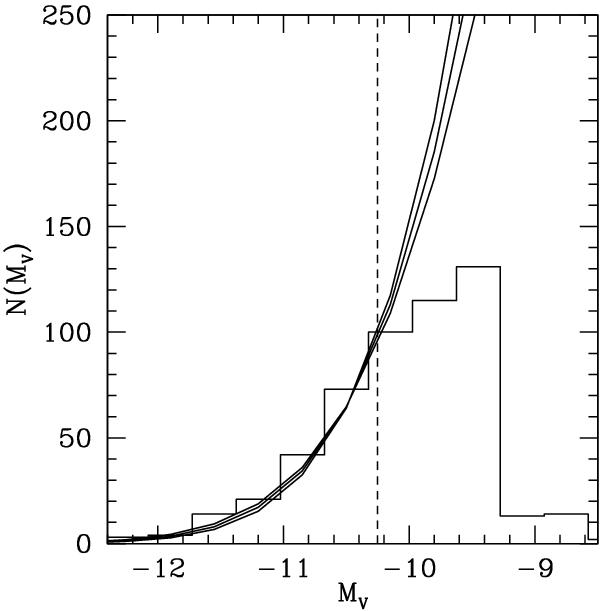
Absolute magnitude distribution of GCs and UCDs shown in Fig. 3. The dotted vertical line indicates the magnitude limit adopted between UCDs and GCs. The curves show Gaussian GCLFs normalized to match the object counts at the UCD magnitude limit. The three lines correspond to different widths σ of the Gaussians: 1.30, 1.35, and 1.40 mag. The completeness of the spectroscopic surveys drops at about the UCD limit.
Current usage metrics show cumulative count of Article Views (full-text article views including HTML views, PDF and ePub downloads, according to the available data) and Abstracts Views on Vision4Press platform.
Data correspond to usage on the plateform after 2015. The current usage metrics is available 48-96 hours after online publication and is updated daily on week days.
Initial download of the metrics may take a while.