Free Access
Fig. 3
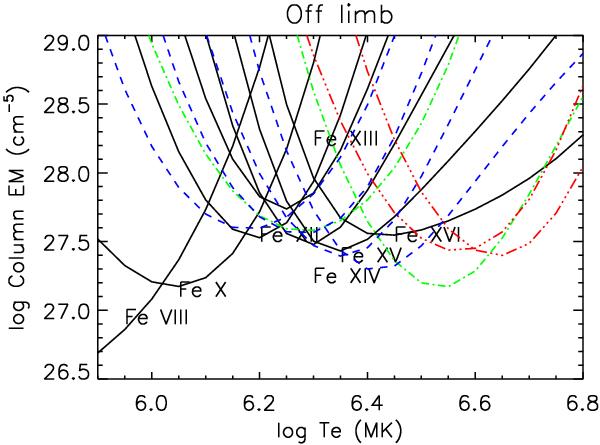
EM loci curves for the 2007 Aug. 19 off-limb active region spectrum and a selection of iron (solid lines), sulfur (dashed), argon (dot dash), and calcium (dash triple dots) ions. The Asplund et al. (2009) photospheric abundances were adopted (with the exception of sulphur, decreased by a factor of 1.7).
Current usage metrics show cumulative count of Article Views (full-text article views including HTML views, PDF and ePub downloads, according to the available data) and Abstracts Views on Vision4Press platform.
Data correspond to usage on the plateform after 2015. The current usage metrics is available 48-96 hours after online publication and is updated daily on week days.
Initial download of the metrics may take a while.