Fig. 5
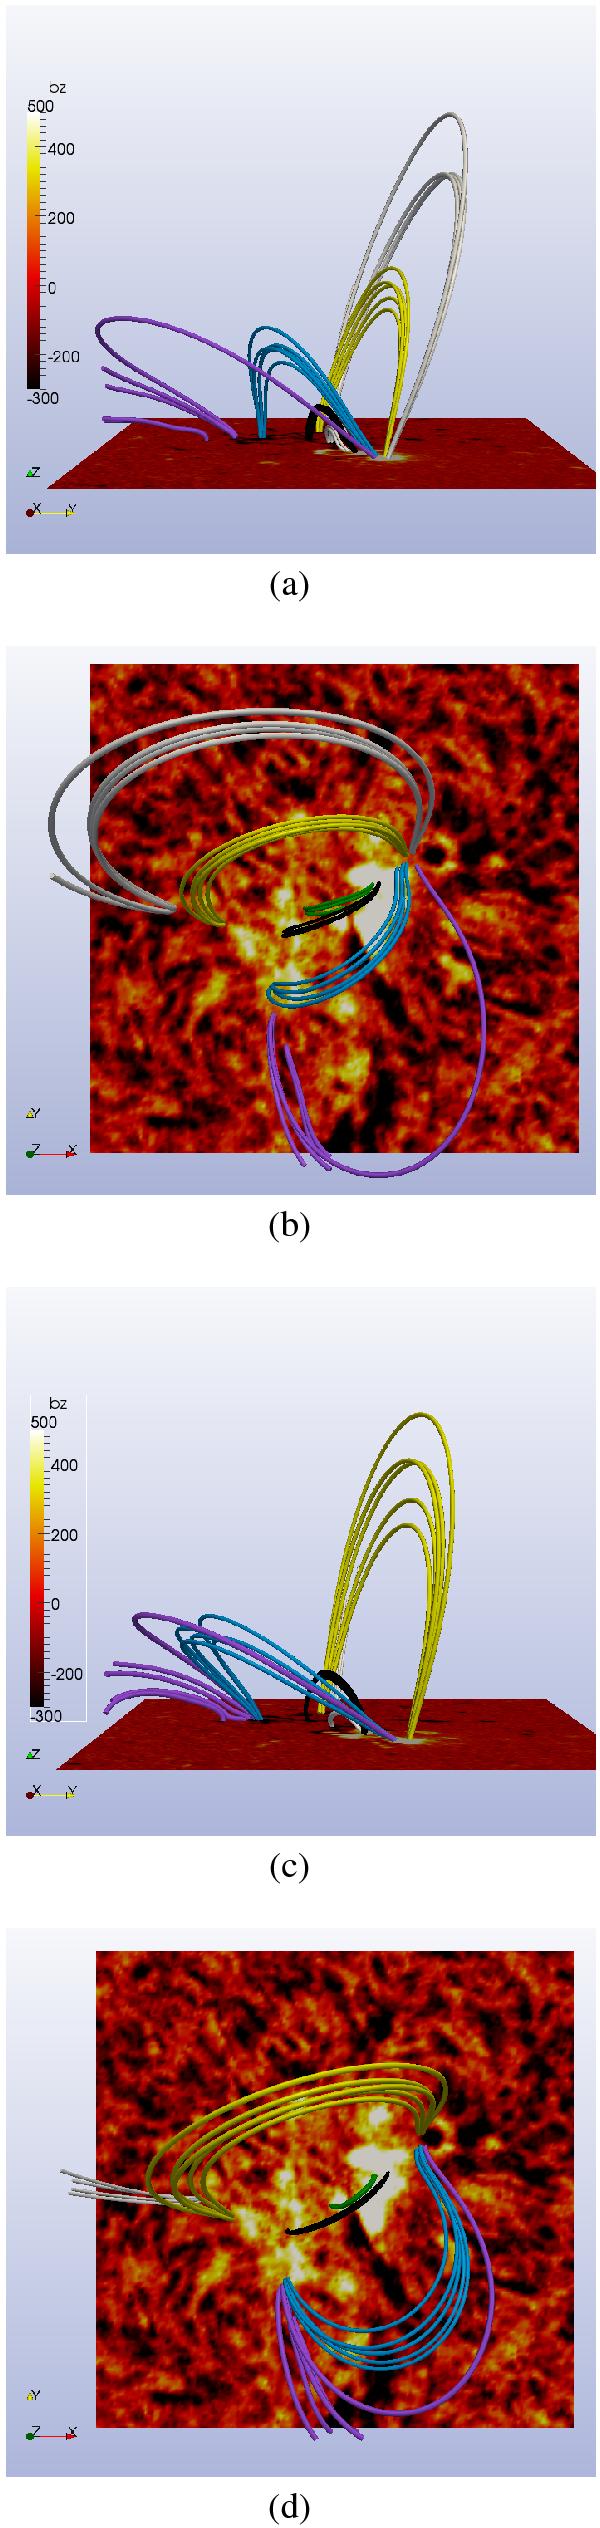
Top and side views of the potential field extrapolations for the MDI magnetograms of the AR 11059 taken on 2010 April 2 at 09:35 UT a), b) and on 2010 April 3 at 07:59 UT c), d), superimposed on the Hα images. In the side view, the red-white color scale is the magnetic field intensity. Different colors indicate different field lines bundles. Same colors between figures a), b) and c), d) indicate field lines starting from the corresponding flux distribution (see text).


Current usage metrics show cumulative count of Article Views (full-text article views including HTML views, PDF and ePub downloads, according to the available data) and Abstracts Views on Vision4Press platform.
Data correspond to usage on the plateform after 2015. The current usage metrics is available 48-96 hours after online publication and is updated daily on week days.
Initial download of the metrics may take a while.