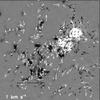
Fig. 4
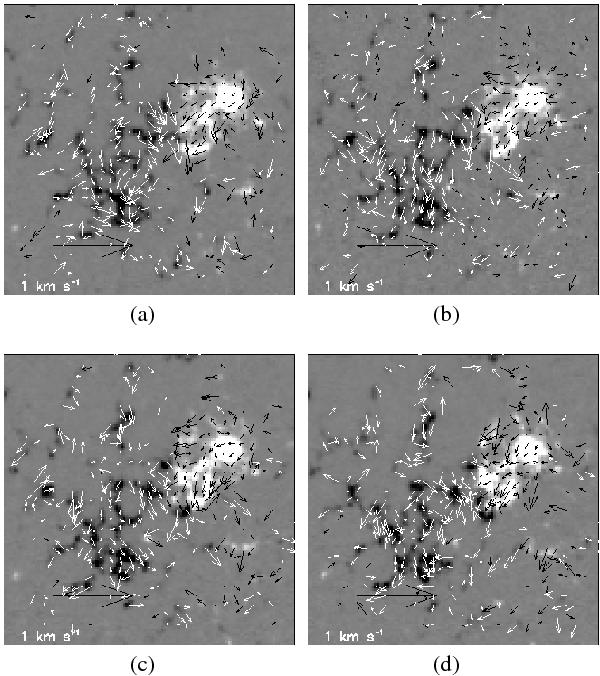
Velocity field maps calculated using DAVE, by means of the magnetograms taken a) on 2010 April 2 between 12:51 UT and 14:27 UT; b) on 2010 April 2 between 17:36 UT and 19:15 UT; c) on 2010 April 2 between 20:51 UT and 22:27 UT; and d) on 2010 April 3 between 03:15 UT and 04:47 UT. The field of view is ~171 × 171 Mm2. North is at the top and west to the right.
Current usage metrics show cumulative count of Article Views (full-text article views including HTML views, PDF and ePub downloads, according to the available data) and Abstracts Views on Vision4Press platform.
Data correspond to usage on the plateform after 2015. The current usage metrics is available 48-96 hours after online publication and is updated daily on week days.
Initial download of the metrics may take a while.