Free Access
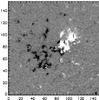
Fig. 3
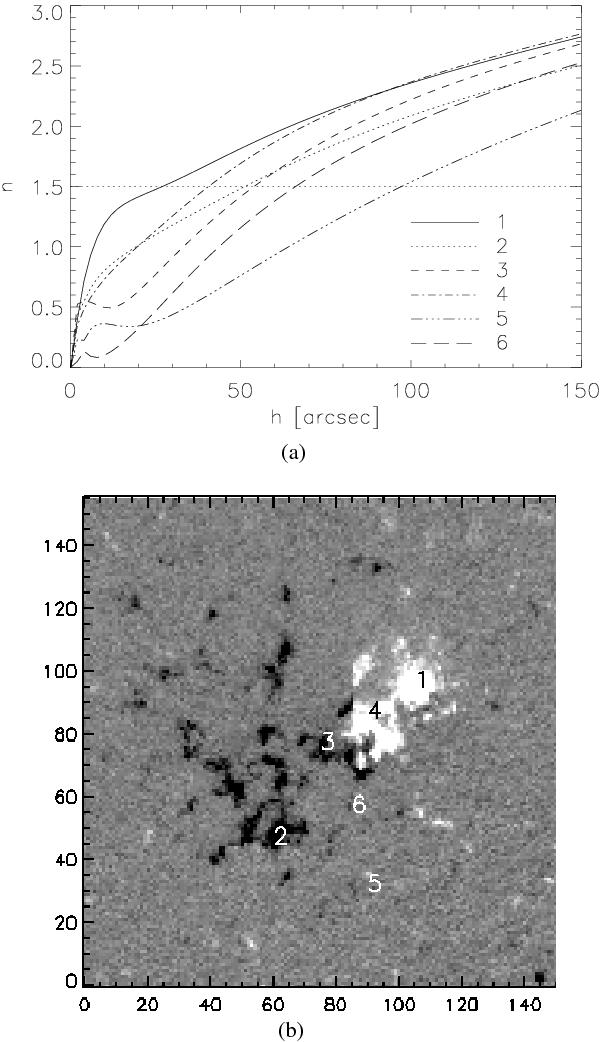
a) Decay index for the potential field extrapolation as a function of the height above the photosphere. Different linestyles indicate different points in the active region; b) MDI magnetogram taken on 2010 April 3 at 07:59 UT. The numbers indicate selected points for which the decay index is shown.
This figure is made of several images, please see below:
Current usage metrics show cumulative count of Article Views (full-text article views including HTML views, PDF and ePub downloads, according to the available data) and Abstracts Views on Vision4Press platform.
Data correspond to usage on the plateform after 2015. The current usage metrics is available 48-96 hours after online publication and is updated daily on week days.
Initial download of the metrics may take a while.