Fig. 7
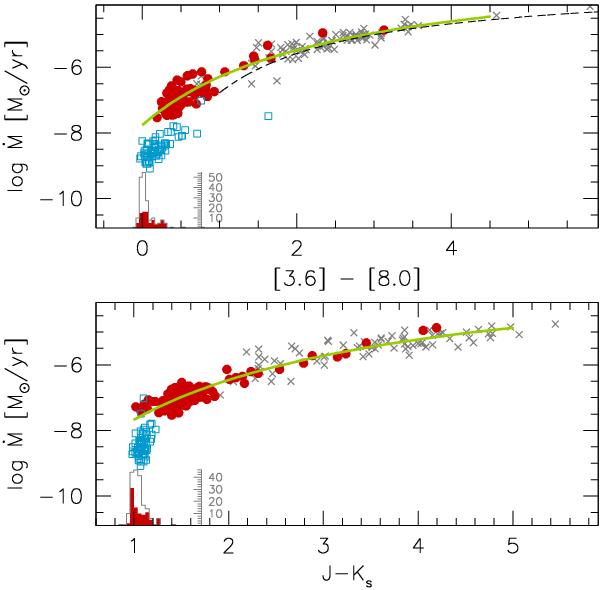
Mass-loss rates as a function of IR colours. Symbols are the same as in Fig. 5. The grey open histogram shows the colour distribution of dust-free AGB stars; the red histogram is the distribution of C-stars alone. The solid line is the best fit to all C-stars, including the Groenewegen et al. (2009) data. The dashed line in the upper panel is the relation of Matsuura et al. (2009).
Current usage metrics show cumulative count of Article Views (full-text article views including HTML views, PDF and ePub downloads, according to the available data) and Abstracts Views on Vision4Press platform.
Data correspond to usage on the plateform after 2015. The current usage metrics is available 48-96 hours after online publication and is updated daily on week days.
Initial download of the metrics may take a while.