Fig. 5
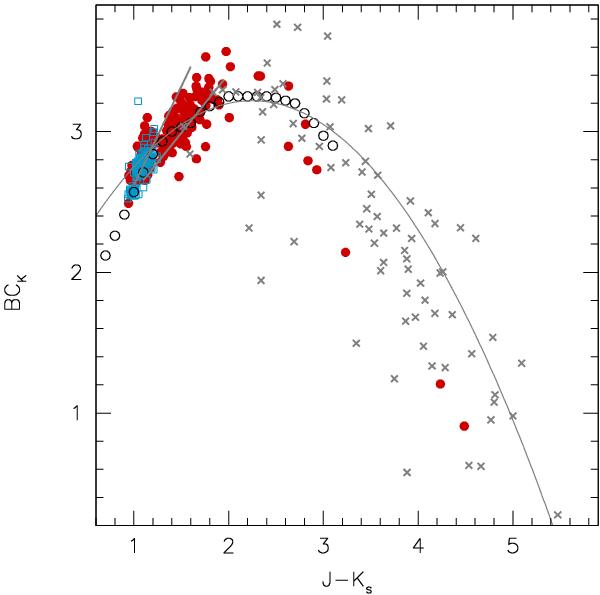
Bolometric correction as a function of near-IR colour. O-rich stars are shown as blue open squares and C-rich stars as filled red circles. Crosses are data for C-stars in the LMC and SMC from Groenewegen et al. (2009). The open black circles show the relation for Galactic C-stars from Bergeat et al. (2002), the lines are taken from Kerschbaum et al. (2010); the curved line is for C-stars, while the two straight lines define the region of O-rich stars.
Current usage metrics show cumulative count of Article Views (full-text article views including HTML views, PDF and ePub downloads, according to the available data) and Abstracts Views on Vision4Press platform.
Data correspond to usage on the plateform after 2015. The current usage metrics is available 48-96 hours after online publication and is updated daily on week days.
Initial download of the metrics may take a while.