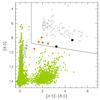
Fig. 1
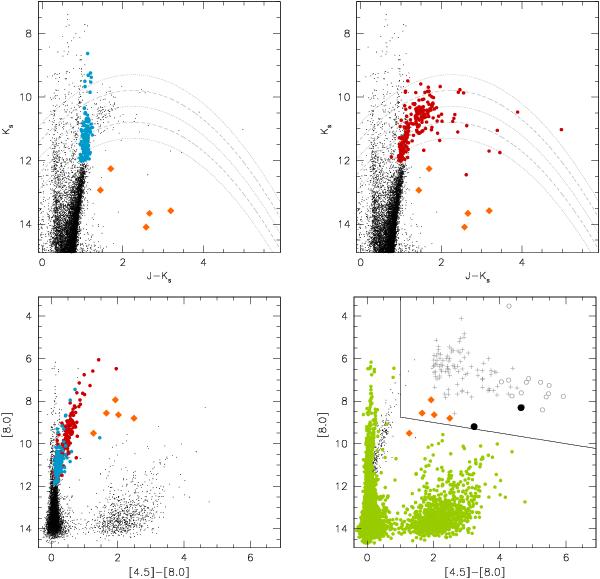
Near- (upper panels) and mid-IR (lower panels) CMDs for stars in the VMC field 8_3. Stars classified as O-rich (upper left panel, blue dots) and C-rich (upper right panel, red dots) are shown as solid symbols. The five non-AGB sources are displayed as diamonds. In the upper panels we plotted curves of constant bolometric magnitudes (Mbol between −6.0 and −4.0, with steps of 0.5 mag) derived using the Ks-band bolometric correction from Kerschbaum et al. (2010). In the lower-left panel all AGB stars are shown as bigger points, while in the lower-right panel bigger (green) points show all stars not classified as AGB candidates using the near-IR criteria. The small grey crosses and open circles show all the sources in the LMC classified as AGB stars and EROs, respectively, by Gruendl & Chu (2009). The filled circles represent the two additional stars selected purely on the basis of the mid-IR photometry using the area delineated by the solid line.
Current usage metrics show cumulative count of Article Views (full-text article views including HTML views, PDF and ePub downloads, according to the available data) and Abstracts Views on Vision4Press platform.
Data correspond to usage on the plateform after 2015. The current usage metrics is available 48-96 hours after online publication and is updated daily on week days.
Initial download of the metrics may take a while.