Fig. 5
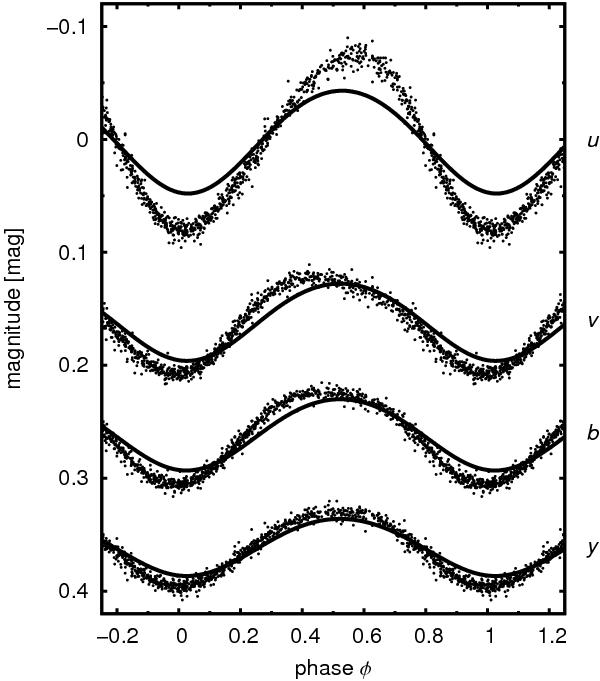
Predicted light variations of CU Vir (solid lines) computed taking into account the helium, silicon, chromium, and iron surface abundance distributions derived by Kuschnig et al. (1999). The observed light variations (dots) are taken from Pyper et al. (1998). The light curves in individual filters were shifted vertically to better demonstrate the light variability.
Current usage metrics show cumulative count of Article Views (full-text article views including HTML views, PDF and ePub downloads, according to the available data) and Abstracts Views on Vision4Press platform.
Data correspond to usage on the plateform after 2015. The current usage metrics is available 48-96 hours after online publication and is updated daily on week days.
Initial download of the metrics may take a while.