Fig. 5
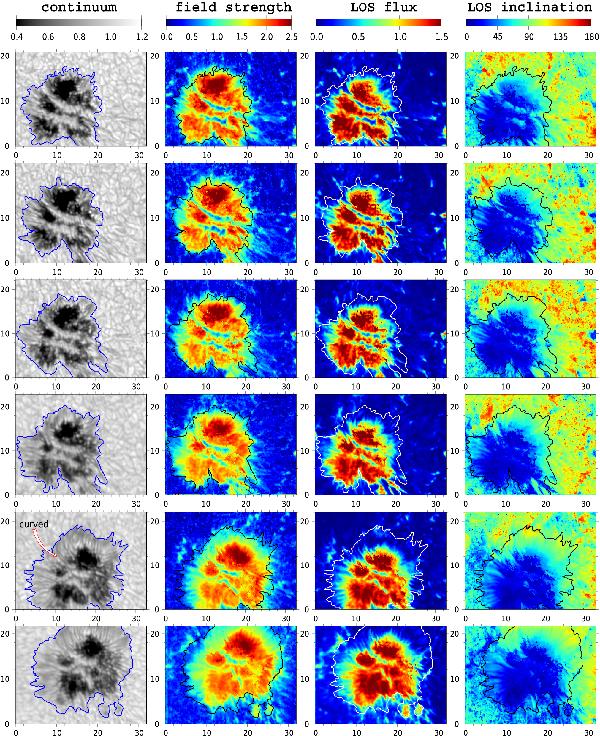
Temporal evolution of the physical parameters of the spot from GFPI data. From left to right we display maps of the continuum intensity (normalized to quiet Sun), magnetic field strength (kG), LOS magnetic flux (1017 Mx), and LOS inclination (deg). From top to bottom, the maps are taken at 08:40, 08:50, 09:28, 10:13, 11:51, and 12:38 UT, respectively. The arrow in the continuum map at 11:51 points to a curved filament. Tick marks are in arcsec.
Current usage metrics show cumulative count of Article Views (full-text article views including HTML views, PDF and ePub downloads, according to the available data) and Abstracts Views on Vision4Press platform.
Data correspond to usage on the plateform after 2015. The current usage metrics is available 48-96 hours after online publication and is updated daily on week days.
Initial download of the metrics may take a while.