Fig. 4
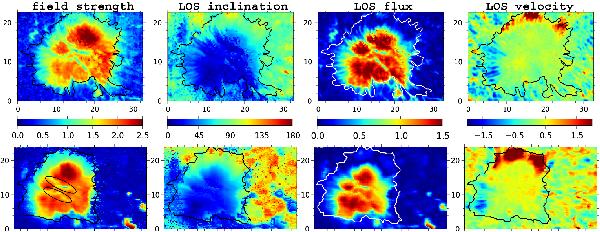
Left to right: maps of the magnetic field strength (kG), LOS inclination (deg), absolute value of the LOS flux (1017 Mx), and LOS velocity (km s-1) for GFPI (top) and TIP (bottom) data. For TIP the magnetic flux is scaled by a factor of 1/9 to accommodate for its larger resolution elements. The ellipses in the field strength map of TIP mark the LBs. Other parameters are like Fig. 2.
Current usage metrics show cumulative count of Article Views (full-text article views including HTML views, PDF and ePub downloads, according to the available data) and Abstracts Views on Vision4Press platform.
Data correspond to usage on the plateform after 2015. The current usage metrics is available 48-96 hours after online publication and is updated daily on week days.
Initial download of the metrics may take a while.