Fig. 3
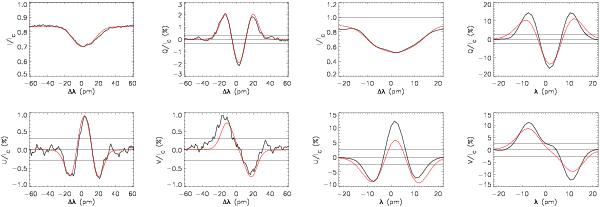
Example of inversion results. The black and red curves show the observed and inverted profiles, respectively. The two sets of profiles correspond to the limb-side penumbra. Left: TIP, right: GFPI. The horizontal lines in Q,U,V panels mark the zero and ± 3 σ noise levels. The GFPI profiles are filtered (cf. Sect. 2.2). The selected inversion setup only produces symmetric profiles, causing the imperfect fit of the e.g., Stokes-I and V of both instruments (Sect. 3.2).
Current usage metrics show cumulative count of Article Views (full-text article views including HTML views, PDF and ePub downloads, according to the available data) and Abstracts Views on Vision4Press platform.
Data correspond to usage on the plateform after 2015. The current usage metrics is available 48-96 hours after online publication and is updated daily on week days.
Initial download of the metrics may take a while.