Fig. 2
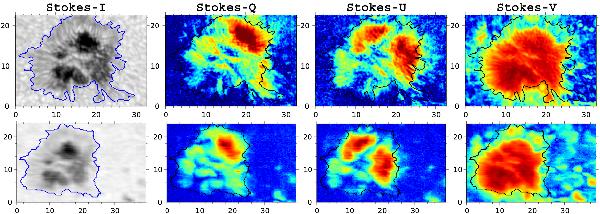
Quasi-simultaneous polarimetric maps of GFPI (Fe i 617.3 nm, top) and TIP (Fe i 1089.6 nm, bottom). From left to right: maps of continuum intensity, I(λc), and the polarimetric states ∫|X(λ)|dλ,X ∈ { Q, U, V } . Contours show the corresponding continuum boundary of the spot (manually drawn). The TIP maps should to be rotated by 3° in clockwise direction to be aligned with GFPI maps. The GFPI data was acquired at 11:54, while the TIP map was scanned from 11:43 until 11:59 UT (from bottom to top). Tick marks are in arcsec.
Current usage metrics show cumulative count of Article Views (full-text article views including HTML views, PDF and ePub downloads, according to the available data) and Abstracts Views on Vision4Press platform.
Data correspond to usage on the plateform after 2015. The current usage metrics is available 48-96 hours after online publication and is updated daily on week days.
Initial download of the metrics may take a while.