Fig. 6
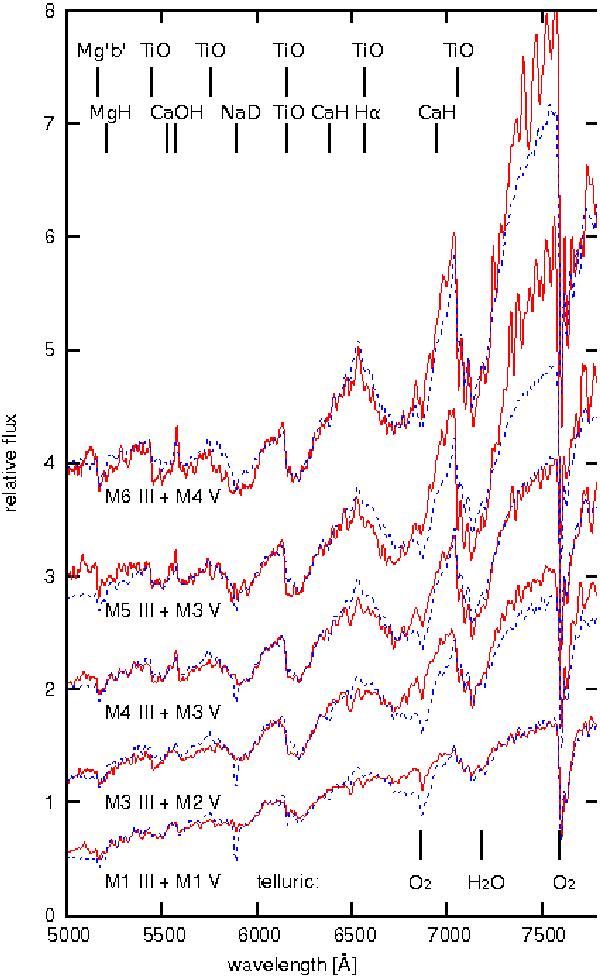
Comparison between average dwarf and giant stars spectra with similar spectral class. The similarities of the two types of spectra increase with increasing the spectral type. The spectra of giants are presented in red and the dwarfs with blue dotted lines. The positions of some of the most characteristic features (upper row for giants, second row for dwarfs) as well as some telluric bands (in the bottom) are shown with black lines. The spectra are shifted along the y-axis with an arbitrary constant for presentation purpose.
Current usage metrics show cumulative count of Article Views (full-text article views including HTML views, PDF and ePub downloads, according to the available data) and Abstracts Views on Vision4Press platform.
Data correspond to usage on the plateform after 2015. The current usage metrics is available 48-96 hours after online publication and is updated daily on week days.
Initial download of the metrics may take a while.