Free Access
Fig. 4
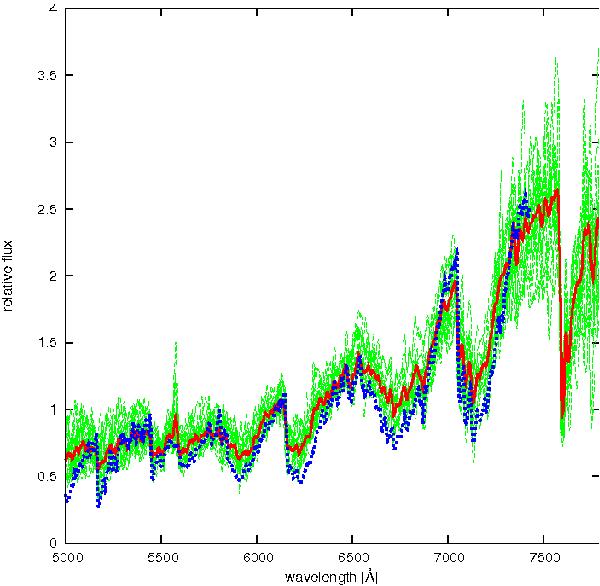
All spectra classified as M4 III are rescaled and plotted together with green lines. An average M4 III spectrum is calculated and shown in red and a reference M4 III spectrum from the library of Jacoby et al. (1984) is drawn with a blue dotted line.
Current usage metrics show cumulative count of Article Views (full-text article views including HTML views, PDF and ePub downloads, according to the available data) and Abstracts Views on Vision4Press platform.
Data correspond to usage on the plateform after 2015. The current usage metrics is available 48-96 hours after online publication and is updated daily on week days.
Initial download of the metrics may take a while.