Free Access
Fig. A.1
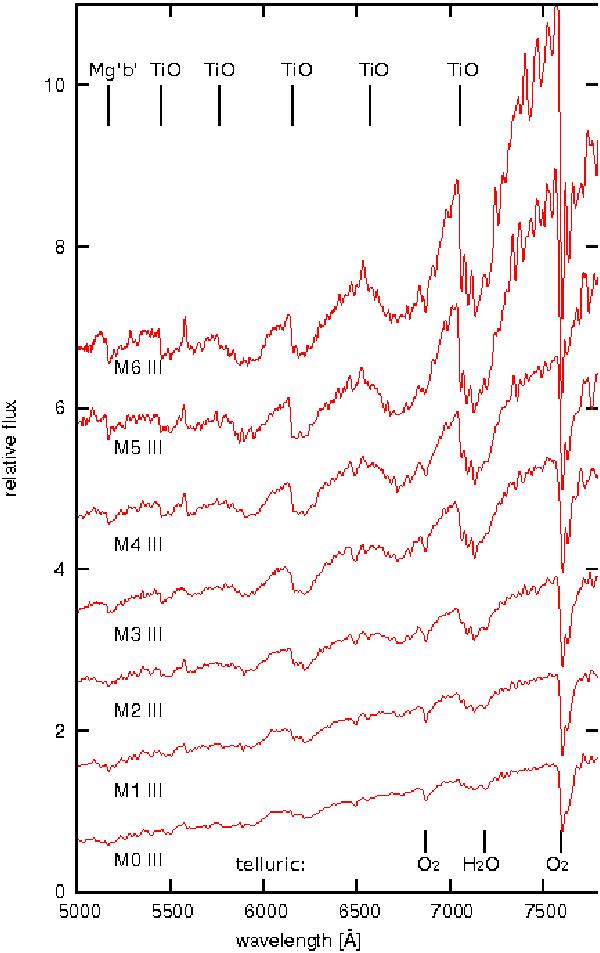
Full sample of average spectra for different spectral types giants according to our classification. The blue edge positions of some of the strongest TiO bands are shown with black lines as well as some telluric bands. The spectra are shifted along the y-axis with an arbitrary constant for presentation purposes.
Current usage metrics show cumulative count of Article Views (full-text article views including HTML views, PDF and ePub downloads, according to the available data) and Abstracts Views on Vision4Press platform.
Data correspond to usage on the plateform after 2015. The current usage metrics is available 48-96 hours after online publication and is updated daily on week days.
Initial download of the metrics may take a while.