Free Access
Fig. 15
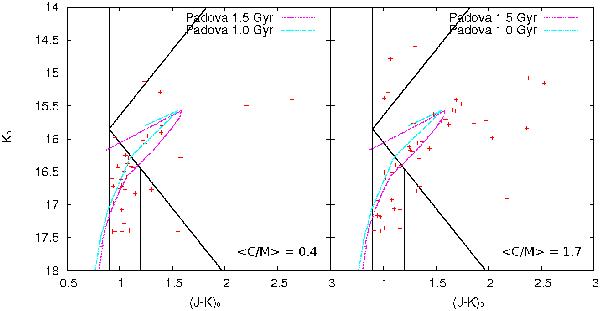
Stars from three regions of high and low C/M ratios are plotted and compared with isochrones for [Fe/H] = −1.0 dex and ages 1.0 and 1.5 Gyr. The selected regions are indicated in Fig. 14. It seems that larger ratios refer to slightly older ages.
Current usage metrics show cumulative count of Article Views (full-text article views including HTML views, PDF and ePub downloads, according to the available data) and Abstracts Views on Vision4Press platform.
Data correspond to usage on the plateform after 2015. The current usage metrics is available 48-96 hours after online publication and is updated daily on week days.
Initial download of the metrics may take a while.