Fig. 13
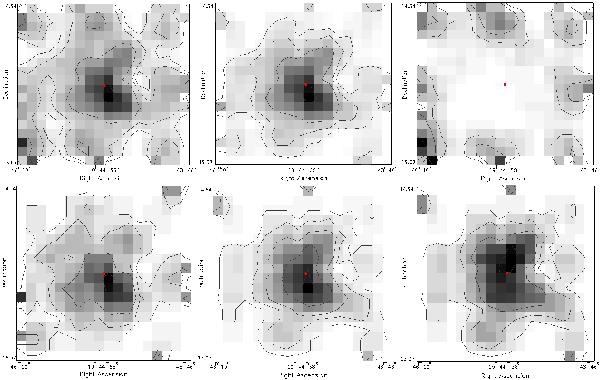
Logarithmic and smoothed density distributions of all stars with good quality spectra. The maps are in 18 × 18 bins 2.0′ × 1.8′ each as follows; top: all stars, all AGB stars, and all dwarf stars (contours are for 0.5,1,2,5 density levels); bottom: M-type AGB stars, C-type AGB stars (contours are for 0.2,0.5,1,2,3 density levels), and C/M ratio map (contours are for ratios 0.2,0.5,1,2). Darker regions correspond to higher density. The centre of the galaxy is indicated with a small red dot. North is up and east is to the left.
Current usage metrics show cumulative count of Article Views (full-text article views including HTML views, PDF and ePub downloads, according to the available data) and Abstracts Views on Vision4Press platform.
Data correspond to usage on the plateform after 2015. The current usage metrics is available 48-96 hours after online publication and is updated daily on week days.
Initial download of the metrics may take a while.