Free Access
Fig. 13
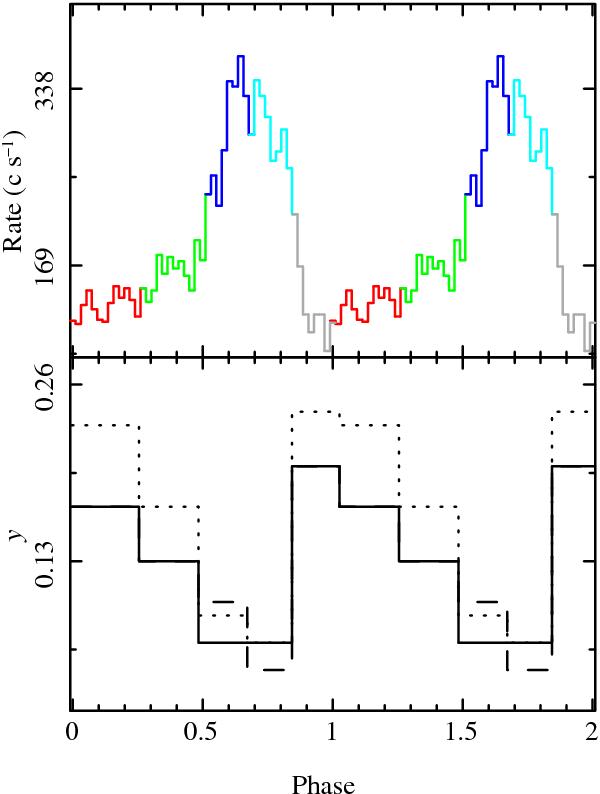
Corona: variability of the Comptonization parameters y with the burst segments. Interval I is represented with a solid line, II with a dashed line, and III with a dotted line. The top panel shows the MECS rate for comparison; two bursts are shown for clarity.
Current usage metrics show cumulative count of Article Views (full-text article views including HTML views, PDF and ePub downloads, according to the available data) and Abstracts Views on Vision4Press platform.
Data correspond to usage on the plateform after 2015. The current usage metrics is available 48-96 hours after online publication and is updated daily on week days.
Initial download of the metrics may take a while.