Fig. 11
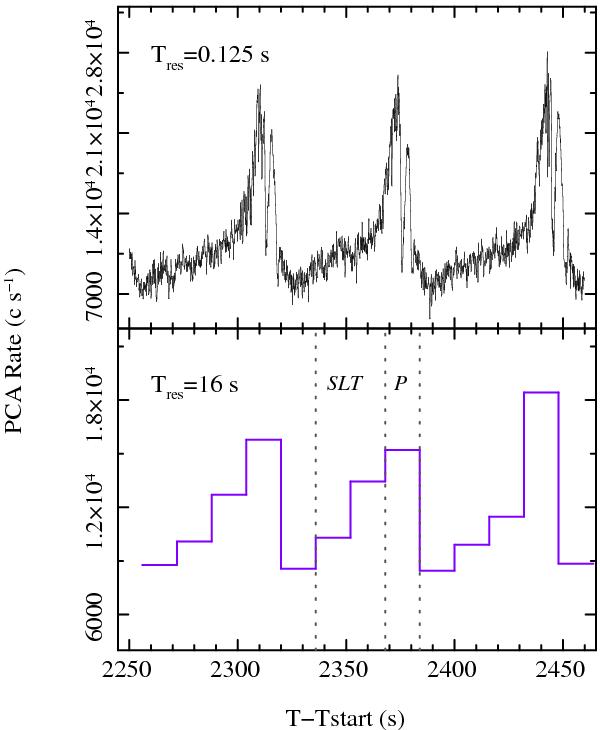
Three bursts as observed by the RXTE/PCA on 2000 October 27 vs. time in s from Tstart. The top panel shows the light curve with 0.125 s time resolution and the bottom panel the 16 s one. Spectral data were only available for the 16 s resolution, and the vertical dashed lines in the bottom panel indicate the two selection intervals (SLT and P) adopted for the spectral accumulations, as explained in the text.
Current usage metrics show cumulative count of Article Views (full-text article views including HTML views, PDF and ePub downloads, according to the available data) and Abstracts Views on Vision4Press platform.
Data correspond to usage on the plateform after 2015. The current usage metrics is available 48-96 hours after online publication and is updated daily on week days.
Initial download of the metrics may take a while.