Free Access
Fig. 1
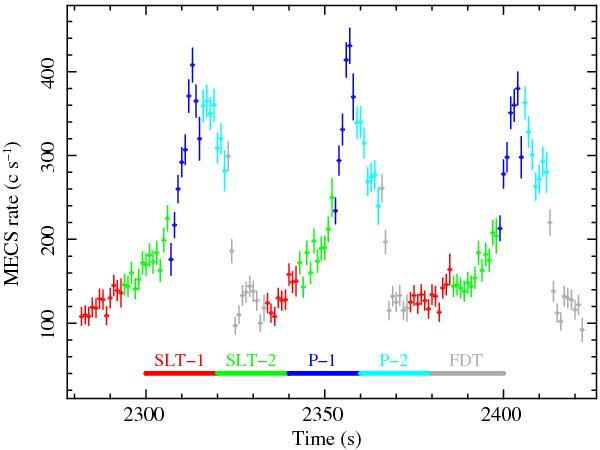
A snap shot of the light curve in the entire MECS energy range of the series A3. Red and green data points indicate the SLT-1 and SLT-2 intervals, blue and cyan points are for P-1 and P-2, and grey points indicate the ending part of the burst (FDT).
Current usage metrics show cumulative count of Article Views (full-text article views including HTML views, PDF and ePub downloads, according to the available data) and Abstracts Views on Vision4Press platform.
Data correspond to usage on the plateform after 2015. The current usage metrics is available 48-96 hours after online publication and is updated daily on week days.
Initial download of the metrics may take a while.